Discover and predict code quality trends

Introducing our new dashboard with Predictions and Timeline
From the beginning we’ve been obsessed with code quality trends and about the important questions that development teams are facing everyday:
- Which areas in the code need to be refactored, simplified, tested or require deeper review?
- How to identify potential software quality issues before the code moves to production?
- How has code quality — and the different metrics that measure it — evolved over time?
- What happens to code quality if we were to merge all the outstanding pull requests?
To help you answer these questions, we’ve introduced today our new code quality dashboard to help predict code quality trends:
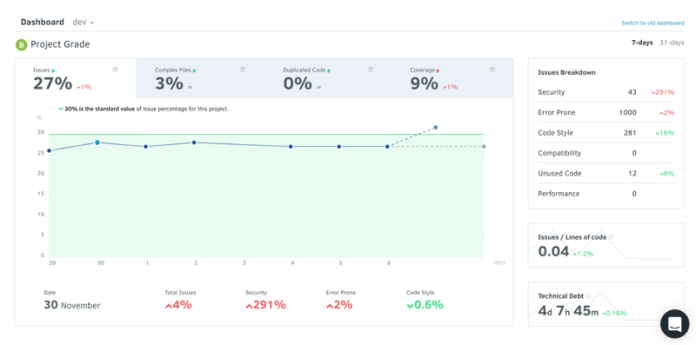
Metrics: We’ve collected in our dashboard the most important metrics you need to be tracking at any time:
- Issues: static analysis problems we identify.
- Complex files: complexity being introduced in your project.
- Duplicate code: copied and pasted code that can be refactored
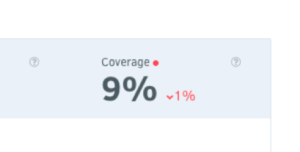
- Coverage: your unit test coverage.
We’ve further added a few more metrics that are important gauges like your issues breakdown, issues/loc and your technical debt measured in days. This answers the question: how is my code quality today?

Status point: for all metrics, we provide you a status color. This will tell you if this metric is something you should pay attention to. Many times some of these metrics are lost without context. With Codacy, we will tell you if there are things you should be worrying about. This is great to quickly understand possible quality problems in your product.
Evolution and baseline: for all metrics, you can see their evolution throughout a period of time that you can select. Furthermore we’ve introduced a green or red baseline in which you are able to compare your history with either our defaults based on Industry benchmark or your desired parameters that you can configure in Codacy’s quality settings. This evolution answers the question: how is my code quality evolving throughout time?
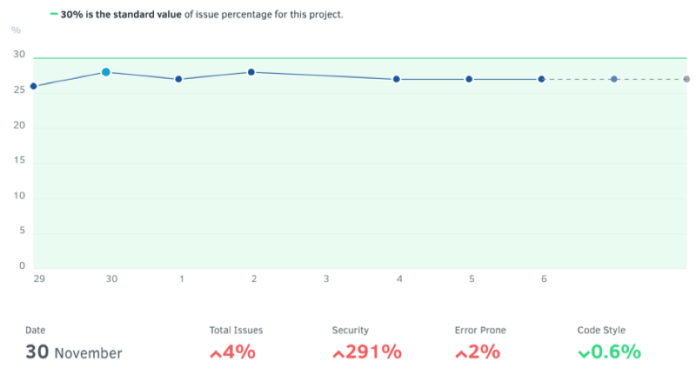
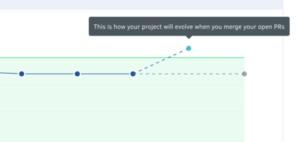
Predictions: a simple, intuitive way to see the future evolution of your code quality if you follow the trend of the past 7 and 31 days. You can see a prediction in terms of Pull Requests (“what would happen if you merged all your pull requests?”) but also in a simpler time projection based on your past 7 or 31 days history.
With these improvements, you’ll be in a better position to:
- Discover code quality trends: you can visualize your commits and metrics in one place, pinpoint which variables have the greatest influence, and identify solutions more easily.
- Enforce quality standards: the green and red lines define the quality boundaries that you configure in your project quality settings.
- Augment your code reviews: the simple, visual interface helps you identify the areas that require greater attention so you can have more meaningful discussions.
- Improve your meetings and reporting: Bring your insights to meetings and balance priorities between the need to focus on developing new features vs. time spent on cleaning up the code and reducing technical debt.
Switching between old and new dashboard
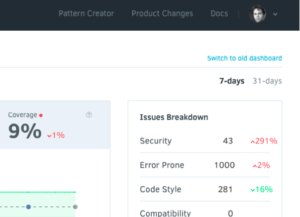
By default you will see the old dashboard when logging in. Switching to the new dashboard is as easy as clicking on the link “switch to new dashboard” in the top right corner. You can always revert to the old dashboard by clicking the same link.
We hope you’ll find these updates useful. Let us know what you think.
P.S. We just published an ebook: “The Ultimate Guide to Code Review” based on a survey of 680+ developers. Enjoy!
About Codacy
Codacy is used by thousands of developers to analyze billions of lines of code every day!
Getting started is easy – and free! Just use your GitHub, Bitbucket or Google account to sign up.
.svg)
