Understanding microservices with distributed tracing

This article will focus on patterns and tools to implement Distributing Tracing particularly for microservices.
Outline
- Motivation
- Distributed Tracing Introduction
- What, Why, How, and Where
- Distributed Tracing
- Transparent tracing
- Explicit tracing
- OpenTracing Implementations
- Summary
- Next steps
Motivation
A typical system now is microservices-oriented, distributed and event-driven, and following its flow of information is a complicated endeavor. Moreover, instrumenting such a system to trace the flow of information has, at least historically, been an intricate task.
In this article we will take a look at patterns and tools to implement Distributed Tracing. We will use Scala tools as examples, but all of the concepts apply to many other languages, for which you can find similar tooling.
Tracing provides visibility into a system and even an application as it grows and interacts with more external components. But setting up instrumentation and deciding which tracer to use can become a large project. The OpenTracing protocol has changed the way we do instrumentation by making it possible to instrument applications with minimal effort and in a more standardized way across languages and platforms.
Distributed Tracing Introduction
What
Distributed tracing, also called distributed request tracing, is a method used to profile and monitor applications,
especially those built using a microservices architecture.
Distributed tracing helps pinpoint where failures occur and what causes poor performance.citeopentracing.io</cite>
In a system each request is assigned a unique ID (usually injected into the headers). This transaction is normally called a trace.
ATraceshows the data flow or execution path through a distributed system and is composed of one or multiple spans.
ASpan in the trace represents a logical unit of work. For instance, a database query could be a span in a trace of a user creation in a CRM. Each span has a unique ID. Spans can create subsequent spans called child spans, and child spans can have multiple parents. Spans have a duration and a component associated with them.
AComponent can be the software package, framework, library, or module that generated the associated Span.
In summary, a Trace describes what steps were performed, how they are connected, and how long each took to execute.
Why
Developers should use distributed tracing to monitor applications, particularly microservices architectures. Distributed tracing provides a standard way to debug and monitor modern distributed software systems, and even to optimize the code by understanding the flows inside a request.
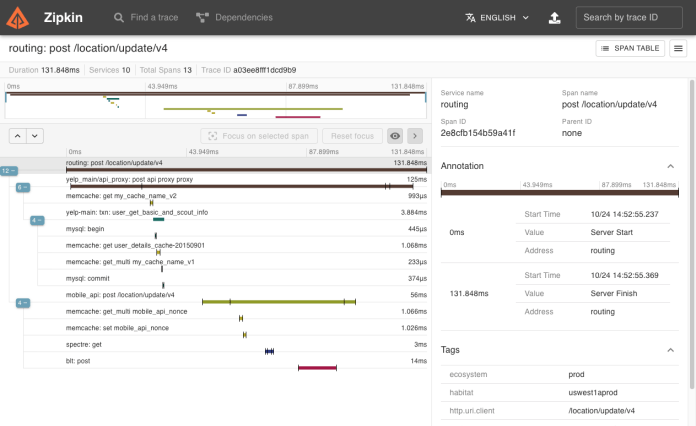
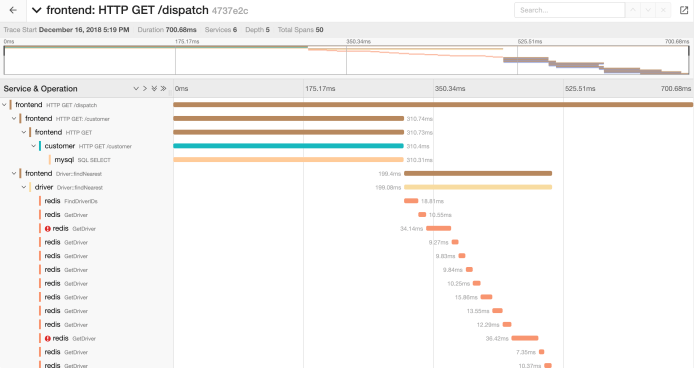
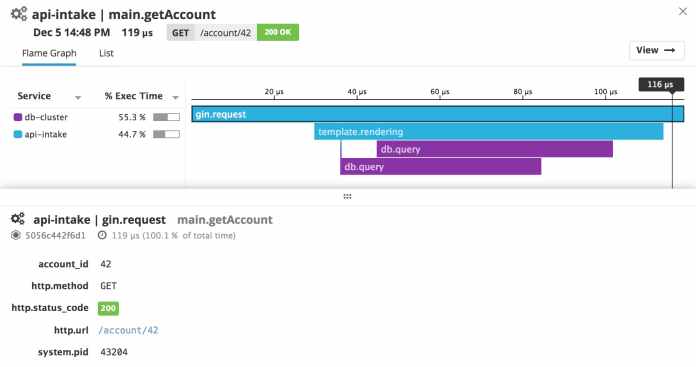
Teams can get a deeper understanding of what is happening within their software system. Most tracing systems produce graphical representations showing how much time a request took on each step and list each known step, which allows for faster discovery of performance issues.
By tracing the path of a request as it travels across a complex system, we can discover the components’ latencies along that path, and which component is the bottleneck.
How
The trace can be represented as a directed acyclic graph (DAG) where nodes are spans and edges are references. The most common representation is a Gantt chart.
When requests begin failing in a system, developers can pinpoint exactly where the issues began instead of testing the system in a binary search tree. Over time, performance changes will be more obvious and traceable from deployment to deployment,
and anomalous behavior will become detectable and evident in the graphs, which can be used to spawn alerts.
Where
Tracing can be implemented at two different layers of your stack: Network and Application. Each layer has disadvantages, but both also offer interesting benefits for different scenarios/use cases.
Network Level
On the Network level, no changes are required to application code, but the information provided is less detailed. Setup is usually simpler since it works as a simple configurable piece in your architecture. This approach is not (very) useful for monoliths since they would mostly have a single span.
Examples of this approach are Istio, Envoy and nginx.
Application Level
Application level is the most common implementation since this provides detailed traces and more context (as much as needed). However, it increases code(*) complexity and requires dedicated support for different frameworks/tools.
(*) – Some alternatives can minimize this impact and are usually referred to as transparent options.
Examples of transparent application tracing are Kamon, the Datadog agent, and Lightbend Telemetry. For manual/explicit tracing, there is the OpenTracing SDK.
In modern architectures using technologies like Kubernetes, network level tracing is becoming more common,
especially with its ease of use and management of what is called a sidecar (e.g., Istio).
Distributed Tracing in Scala
At the time of writing (February 2019), there is still no official support for Scala from the OpenTracing initiative.
Transparent tracing
All of the transparent tools available:Datadog Agent,KamonandLightbend Telemetry work in a similar way, by adding a Java agent to the JVM where your application is running. This agent collects information based on your configuration, and the results are posted to a backend (e.g., Zipkin, Jaeger Datadog, Elasticsearch, StatsD, JMX, etc.).
Explicit tracing
Since no officially supported Scala SDK is available for OpenTracing, we can use opentracing-java. The APIs are quite simple, but you will end up with some big chunks of code to wire all of the pieces together. Propagation of context is also non-trivial and may pollute the code as usage increases. Petra Bierleutgeb gave a talk called Connecting the dots with distributed tracing at Scala Exchange where she explains how to mitigate this and still have nice tracing in your monolith.
OpenTracing Implementations
Currently, multiple implementations of the OpenTracing specification are available for production use. Zipkin and Jaeger are the most well-known open source solutions providing a very good interface for displaying the data sent by your apps.
Jaeger is hosted by the Cloud Native Computing Foundation like the OpenTracing initiative.


Datadog is the most well-known commercial solution of the OpenTracing specification and, together with its agent, provide a complete set of solutions from development to visualization of your tracing data.

Summary
OpenTracing provides a great specification that allows you to program against a very well-defined API instead of a concrete implementation. With no vendor lock-in or incentivization, it has an open community of developers contributing new OpenTracing-compatible tracers.
Next steps
Even when adopting an OpenTracing solution with a backend like Jaeger, there is still a lot of work left for the developer.
Furthermore, while OpenTracing covers most of our tracing needs, it does not include a metrics API within its scope. A new OSS framework has recently been proposed that unifies these concerns.
OpenCensus is a framework for telemetry collection that includes APIs for tracing and collecting application metrics. It provides several backends out of the box and a clear API for adding more. Much like OpenTracing, OpenCensus supports a variety of backends such as Jaeger, but also has support for proprietary tracing backends such as AWS X-Ray.
OpenCensus provides some interesting features such as sharing context propagation between metrics and tracing so that metadata can be added to metrics and traces.
Being able to have everything at one point in time, grouped, ordered, or with a specific hierarchy enables you to aggregate, compare, and alert based on concrete data about your system.
Ideally, in my opinion, a powerful implementation should be able to meet all of these needs. For instance, OpenCensus looks good from an ingestion point of view but provides nothing in the way of logs.
We need to be able to cross logs, traces, and metrics from infrastructure and application events from dashboards and automatic tools. Datadog is one of the services currently providing most of these features, but I would love to see more services, especially open source solutions, going in this direction.
What is your view on tracing? How did you solve these problems in your infrastructure?
You can send your thoughts and ideas to me directly @rtfpessoa or @codacy on Twitter.
About Codacy
Codacy is used by thousands of developers and teams to analyze billions of lines of code every day!
Getting started is easy! Just use your GitHub, Bitbucket or Google account to sign up.
.svg)
