If you’ve been using Codacy for some time, you’re going to be excited to know that a new release is in the works. The changes in store include a range of improvements to the existing functionality, along with a range of new features.
In this post, I’m going to take you through a number of the key changes and show you how they’re going to make your life both simpler and less time-intense when managing the quality of your code with Codacy.
We’ll start off with the new additions. Because, after all, who doesn’t like new, shiny features? Then we’ll finish up by looking at the improvements to existing functionality.
One quick thing before we dive on in, though. If you’re a long time Codacy user, please don’t think that this update will require you to relearn what you already know. It doesn’t.
While the new release does add new functionality and both improve and better organize existing functionality, you should be right at home with what you’ll see. In fact, it should not take you very long at all to settle into them, before you appreciate the benefits.
New Additions
Okay, let’s start off by looking at the new additions to the Codacy UI. These changes offer the following advantages:
- Provides more comprehensive information
- Makes the dashboard more intuitive to use
- Makes essential information easier to find
- Shows information at the personal level
- Shows information at the team level
The Organisation Dashboard
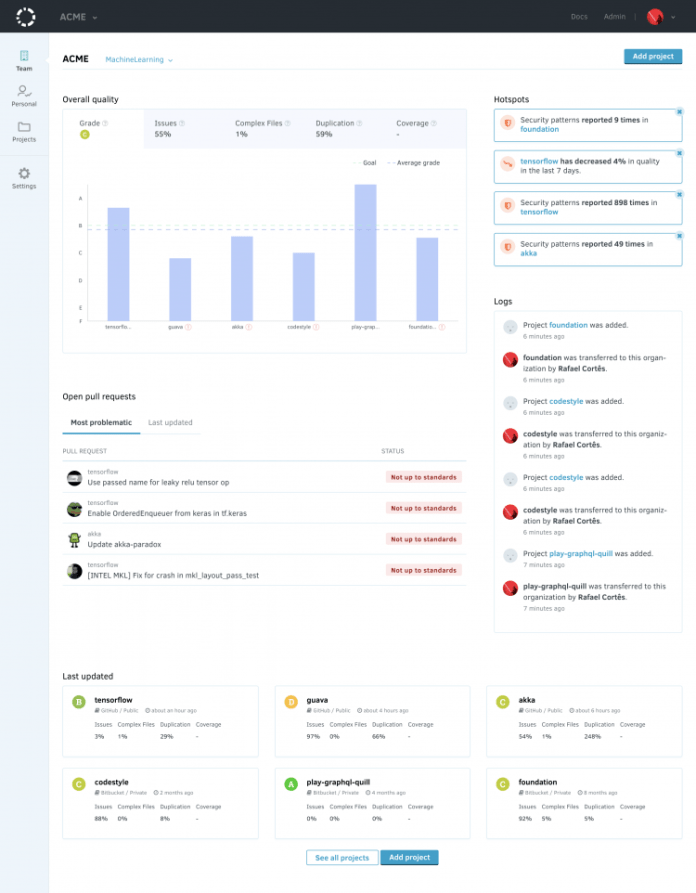
The first addition is the “Organisation Dashboard” which, as the name implies, displays project information based on the collaboration of one or more teams. This dashboard is composed of several sections, of which we’re going to look at three. These are:
- Overall quality chart
- Hotspots
- Open pull requests
- Logs
Overall quality chart
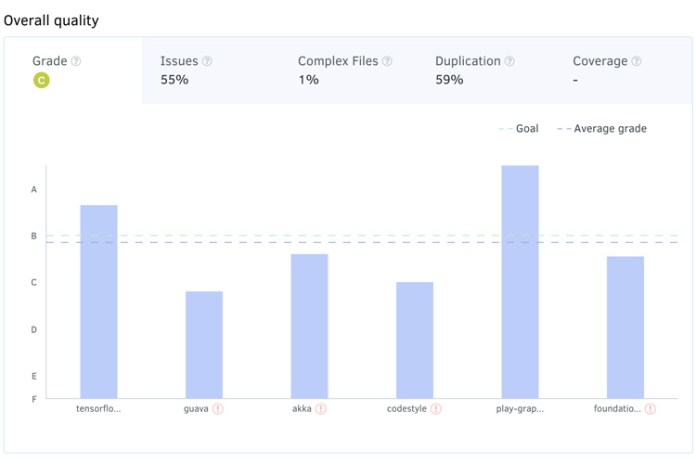
By implementing the overall quality chart we hope to provide you with a general idea of the status of your organisation’s code. You can easily analyse the main metrics of your organisation’s code quality, namely:
- Grade
- Issues
- Complex Files
- Duplication
- Coverage
Hotspots
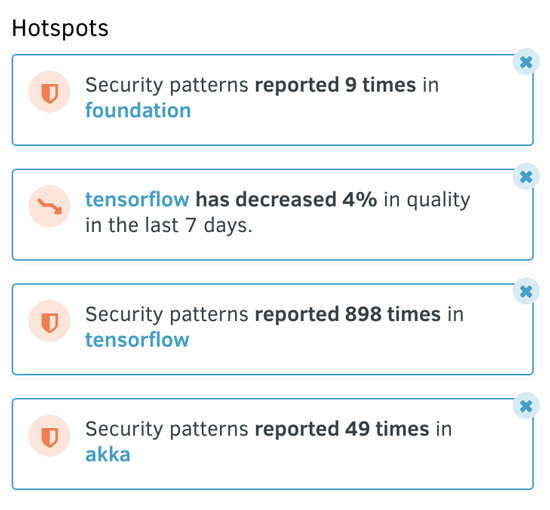
Next, let’s look at Hotspots. Hotspots are notifications about critical areas of interest, ranging in severity from general interest to items needing urgent attention, such as security.
The type of notifications you can expect to receive in the Hotspots are the following:
- Number of abandoned PRs
- Number of security issues found
- Number of security issues found for a given security pattern
- Number of PRs “Not up to standards”
- Quality variation for the last 7 days
Open Pull Requests
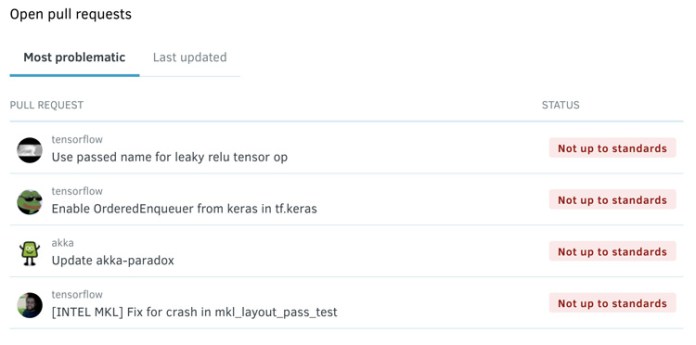
Arguably one of the most critical areas of project analysis, “Open Pull Requests” has gotten a significant refresh. You can see that there are now two tabs:
- Most problematic; and
- Last updated.
Singling out “Last updated“, you can quickly see a series of information about the listed pull requests. This includes:
- The user who most recently contributed to the PR, by their avatar.
- The project that the PR relates to.
- The commit comment title; and
- Whether the project meets the assigned quality standards.
Having the information displayed in this way, while visually appealing, also makes it easy to stay abreast of the health of a range of PRs (currently a maximum of 5).
Logs
Now let’s look at logs. Perhaps not as important as Hotspots or Open Pull Requests, Logs are still important nonetheless. This is because they help you to stay abreast of the activity within your project at a glance.
Like most other logging systems, the Logs panel lets you see a range of project activity directly caused by team members as well as system activity. The image below shows an excellent example of this.
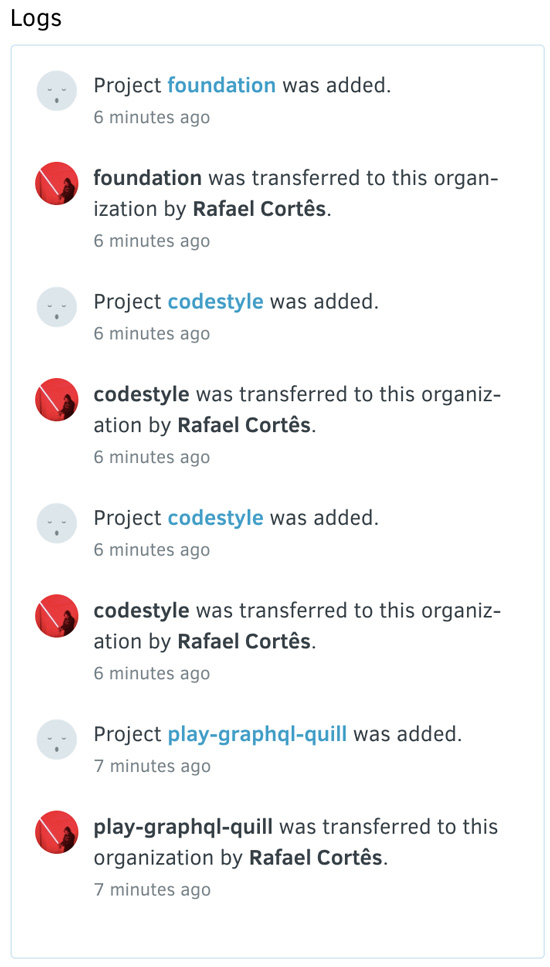
This provides a high-level analysis of what’s going on in a project.
The Personal Dashboard
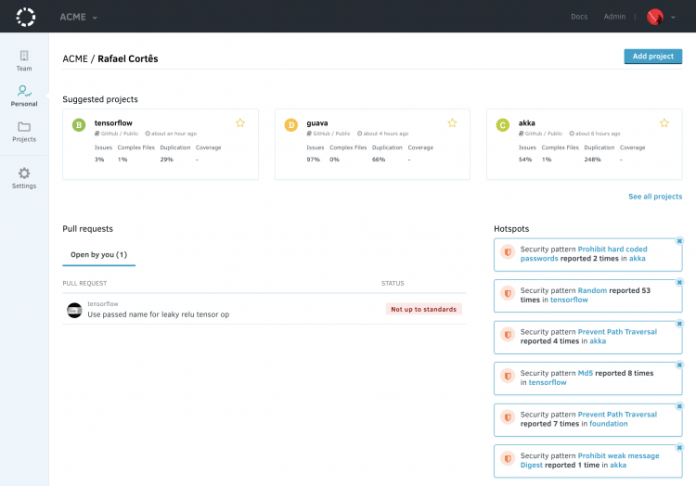
Next up, is the personal dashboard. This dashboard is a personal view of all the projects that matter to you in the organisation, listing all the created pull requests.
Similar to the team dashboard, this new dashboard is composed of three sections: Starred projects, Pull requests, and Hotspots. Of these three, we’ve already covered Pull Requests and Hotspots. So let’s dive into the new one Starred Projects.
As the name implies, this section contains a quick overview of projects that you’ve starred for a range of reasons. These could include projects with high priority, ones that are long-running or have another form of particular significance.
This widget shows three, yet provides a handy link to a complete list of all starred projects. Within each of the three displayed project summaries, you can see the essential information that you already have on hand in the project dashboard, which includes the project’s grade, Issues, Complex Files, Duplication, and Coverage.
Improvements
Now that we’ve looked at two new additions let’s now look at a number of the improvements in the Codacy UI, starting off with the Project Dashboard.
The Project Dashboard
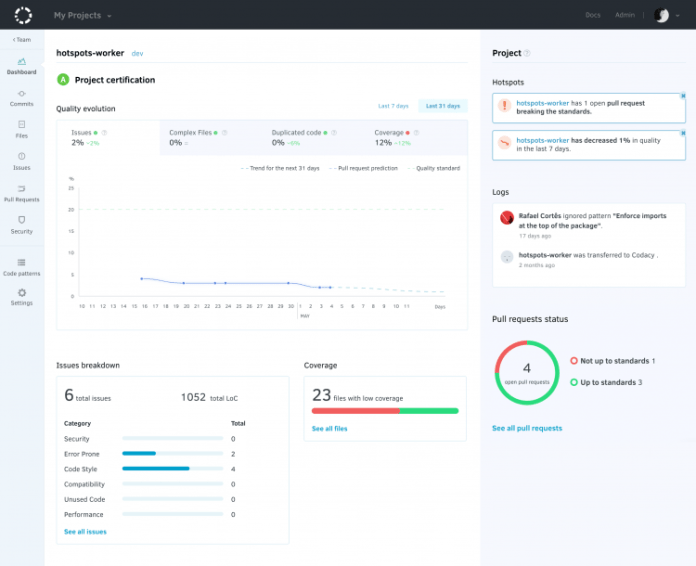
The project dashboard has been, significantly improved! The fundamental differences, however, are the introduction of a quality evolution dashboard, which takes center stage, and moving the issues breakdown and coverage analysis below the quality evolution dashboard.
Issues Breakdown and Coverage
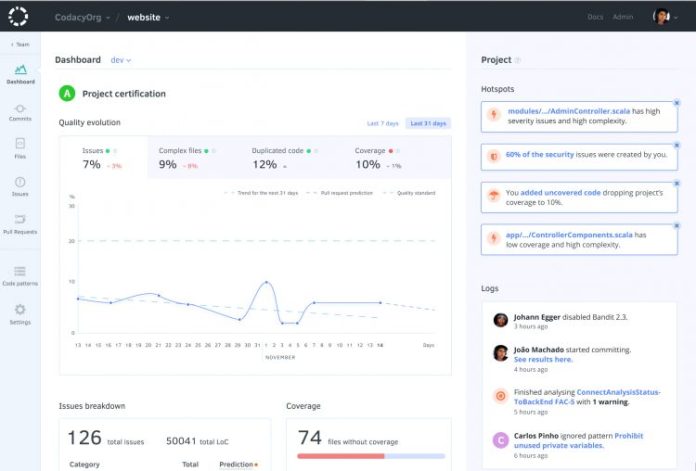
Finally, let’s look at how Issues Breakdown and Coverage have changed. The information is presented in a more transparent and more succinct way.
What’s more, by taking the approach that they have, Codacy’s able to pack in a range of further details, such as total lines of code.
In the existing iteration, by focusing purely on the numbers alone, you only know what’s happening at a given moment in time. By using Quality Evolution chart, you see a trend, which is much more empowering.
To Sum Up
So, in summary, the new workflow that Codacy has just released, brings a wealth of new features, along with a range of improvements to existing functionality.
All these changes have been designed to make your life far easier than it has been to date, to allow you to spend less time and to work more efficiently with your projects than ever before.
I hope that you see the potential that these changes offer. That said, whether you’re for them or have reservations, please share your thoughts in the comments. I know the team would love your input.
Codacy is used by thousands of developers to analyze billions of lines of code every day!
Getting started is easy – and free! Just use your GitHub, Bitbucket or Google account to sign up.
.svg)


