.svg)


Measuring performance is complex. Engineering managers must understand how individual contributors are performing and how the team combines to produce code. Add to that the problem that engineering managers lose visibility as products become more complex and organizations grow.
Checking in to dailies and having ad-hoc conversations is no longer sustainable. So, how can you keep visibility over the pace and quality of your product?
DORA metrics were created at Google for this problem. Engineering teams need the proper visibility and data to make the best decisions to improve and deliver software continuously.
Having the means to measure and evaluate the effectiveness of the software development strategy is a critical factor in setting and achieving your goals. DORA metrics allow you to do this, giving teams four clear, key indicators of software development and delivery performance.
Let’s introduce each and then take a closer look at how they can help your organization.

What Are the Four DORA Metrics?
The four DORA metrics provide a data-driven approach to analyzing and improving performance. They are:
- Deployment frequency: how often your organization completes a deployment to production.
- Lead time for changes: how long it takes for a commit to get into production.
- Time to recover: how long it takes your organization to recover from a failure in production.
- Change failure rate: percentage of deployments causing a failure in production.
The underlying ethos of these metrics is to optimize and streamline the software development and deployment process by focusing on speed, efficiency, and reliability. Each metric addresses a vital aspect of the development cycle, encouraging a culture of continuous improvement and rapid delivery while maintaining high quality and stability in production environments.
Let’s go through each.
Deployment Frequency
Deployment frequency measures how often code is deployed to production. This metric correlates with the speed of your engineering team. You want your team to deploy little and often. Your team’s goal should be to perform small deployments with a high frequency, as reducing the size of deployments and the number of changes for each cycle makes it easier to test and release the deployment.
This ensures that changes are manageable and issues can be identified and resolved quickly, reducing the risk of large-scale failures and minimizing downtime. It also facilitates continuous feedback and improvement, leading to a more agile and responsive development process.
The Accelerate State of DevOps 2021 report suggests that elite performers deploy on-demand multiple times daily, while low performers deploy fewer than once every six months. A good cadence for a high-functioning team is at least weekly deploys, with the team pushing for small deployments daily.
To improve deployment frequency, you can:
- Adopt Agile Workflows: Break tasks into smaller segments for more manageable releases.
- Increase Automation: Use continuous integration and deployment tools for automated testing and delivery.
- Introduce Feature Flags: Implement toggles to control feature release without affecting deployment.
- Add Monitoring: Foster real-time monitoring for immediate feedback and rapid issue resolution.
- Move to a Microservices Architecture: Structure applications as a collection of loosely coupled services to enable independent deployments.
Increasing deployment frequency offers significant benefits, such as accelerated feedback loops, enabling quicker iterations based on user input. It also promotes a minor change set in each deployment, typically leading to fewer bugs and less complex issues, improving code quality and stability.
However, increased deployment frequency does come with risks. A higher deployment frequency can lead to burnout if teams are not adequately supported. It also requires a robust testing environment to prevent frequent deployments from introducing uncaught bugs into production. Careful management and a well-structured process are essential to mitigate these risks and fully realize the benefits.
Lead Time for Changes
Lead time for changes measures the time a commit takes to reach production. This metric correlates with the speed of your engineering team and is a good indicator of your team’s response time, code complexity, and capacity.
Elite teams measure lead time for changes in hours, while poor-performing teams measure it in months. If your team is committing code, but that code is getting backed up and never reaching production, this is a huge issue. It means there's a bottleneck in your delivery pipeline, potentially due to inefficient processes, over-complicated code, or a lack of automation. This slows down customer value delivery and demotivates engineers who don't see their work being utilized.
Addressing these bottlenecks is crucial for improving your team's lead time for changes. To improve lead time for changes, you must:
- Streamline Development Processes: Identify and eliminate inefficiencies in your development pipeline.
- Simplify Code: Reduce code complexity to speed up development and testing.
- Implement Continuous Integration/Continuous Deployment (CI/CD): Automate the integration and deployment processes to accelerate the flow from commit to production.
- Enhance Collaboration: Foster better communication and collaboration between developers, testers, and operations teams.
- Frequently Test: Integrate regular testing into the development cycle to identify and fix issues early.
- Establish Feedback Loops: Establish rapid feedback mechanisms to address any issues that arise quickly.
- Monitor and Analyze: Regularly monitor the pipeline and continuously analyze bottlenecks to improve processes.
Improving lead time for changes in software development not only streamlines processes but significantly boosts team morale and customer satisfaction. When teams see their efforts rapidly translate into tangible results, it instills a sense of achievement and purpose. This morale boost is crucial for sustaining high productivity and fostering a positive work environment.
Concurrently, customers benefit from quicker implementations of new features and resolutions to issues. This responsiveness enhances the customer experience, leading to increased satisfaction and loyalty.
Optimizing lead times creates a virtuous cycle, where motivated teams produce better results, and satisfied customers feed back positively into the development cycle. This synergy between team morale and customer satisfaction is fundamental to maintaining a competitive edge in the fast-paced world of software development.
Time to Recover
Time to recover measures how long it takes to recover from failure. This metric correlates with the quality of your engineering team and is a good indicator of your team’s response time and overall development process efficiency.
This metric analyzes the robustness and resilience of your development processes and the effectiveness of your incident management strategies. It's an essential indicator of how quickly your team can address and resolve issues, minimizing downtime and maintaining service quality.
You want your team to push code quickly and respond to bugs and customer issues quickly. Like with lead time, elite teams can respond within an hour; poor teams take months to respond.
If you need to improve the time to recover metric, you must:
- Implement Robust Monitoring Systems: Implement comprehensive monitoring tools that provide real-time insights into system performance and alert the team immediately when issues arise. This allows for quicker identification and diagnosis of problems.
- Develop Effective Incident Response Plans: Develop detailed incident response protocols for various scenarios. Ensure these plans are easily accessible and regularly updated to reflect new technologies and practices.
- Foster a Blameless Post-Mortem Culture: Create an environment where team members feel comfortable sharing mistakes and learning from them. Conduct regular post-incident reviews to identify root causes and prevent future occurrences without focusing on individual blame.
- Invest in Automated Recovery Solutions: Utilize tools that automatically detect failures and perform predefined actions to minimize downtime. This includes failover mechanisms and automated backup systems.
- Regular Disaster Recovery Drills: Regularly schedule and conduct disaster recovery simulations. These drills should mimic real-life scenarios as closely as possible to ensure your team is prepared for actual incidents.
- Continuously Train Your Team: Keep your team's skills sharp with ongoing training in the latest incident response techniques and technologies. Encourage knowledge sharing and upskilling to build a more resilient team.
Teams should focus on creating a well-structured development pipeline that allows for quick releases while maintaining rigorous testing protocols. Automating testing and deployment processes can help achieve this balance, ensuring speed doesn't come at the cost of quality.
This approach accelerates development and maintains a high standard of product integrity, which is crucial for long-term success.
Change Failure Rate
Change failure rate measures the percentage of deployments that caused a failure in production requiring remediation (e.g., hotfix, rollback, patch). This metric is correlated with and is a good indicator of the quality of your engineering practices.
Elite teams might see degraded performance 0%-15% of the time. Lower-performance teams will see failure rates as high as 30%.
A lower change failure rate indicates a mature, robust development process where changes are thoroughly tested and verified before deployment. To achieve such rates, teams need to invest in:
- Comprehensive Quality Assurance Practices: Strong QA practices are vital. They involve rigorous testing procedures, including manual and automated testing, to ensure that every release meets predefined quality standards. Effective QA minimizes the risk of defects reaching production, thus reducing the change failure rate.
- Automated Testing: Implementing automated testing streamlines the process of identifying bugs early in the development cycle. This approach allows for frequent and thorough code testing, significantly reducing the chances of errors in production and contributing to a lower change failure rate.
- Code Reviews: Regular code reviews are essential for maintaining high-quality code. They provide an opportunity for peer feedback, ensuring any potential issues are caught and addressed before deployment. This collaborative process improves code quality and fosters team learning and adherence to best practices and coding standards.
Teams must analyze each failure and learn from these incidents to prevent similar issues in the future. By continuously refining their processes and incorporating lessons learned, teams can steadily reduce their change failure rate, enhancing overall software quality and reliability.
Measuring DORA Metrics With Codacy Pulse
We’ve built Codacy Pulse to help teams understand their DORA metrics and increase overall performance.
Codacy Pulse gives you insight into your team's exact metrics for deployment frequency, lead time for changes, time to recover, and change failure rate:
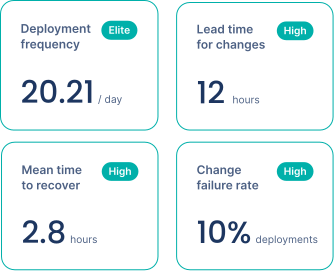
It also shows you the level you are performing at. This allows you to track and benchmark your team's progress, identify areas for improvement, and make informed decisions to enhance your software development practices.
It empowers your team to make the right decisions and make the changes themselves. With the metrics available, they can pinpoint inefficiencies, set realistic goals for improvement, and continuously monitor their progress. This data-driven approach leads to a more efficient, agile, and responsive development process.
For engineering managers, having critical insights at your fingertips enables you to oversee and guide your team's development practices effectively. With Codacy Pulse, you can make data-backed decisions, tailor strategies to your team's needs, and lead your team toward higher efficiency and better performance outcomes.
Pulse handles all the details to ensure your DORA metrics are accurate and reliable. Pulse connects seamlessly with your GitHub, Jira, and PagerDuty to give you DORA and other Engineering metrics out-of-the-box. Your team only needs to focus on making informed decisions to improve your results.
With Pulse, you get:
- Peace of mind when collecting engineering metrics: we do the work for you, ensuring reliable metrics and continuous tracking.
- There is no need to choose what to measure: no need to get caught in output or vanity metrics that are hurtful for your team in the long run; we research for you.
- Historical data: immediately see your performance over the last 90 days – and up to 1 year;
- Easily filter repositories, teams, and periods.
- More metrics beyond DORA to explain how they are evolving;
- Our team and community can help you on the journey of continuous improvement.
Empower your Engineering with the DORA metrics. Connect with GitHub to find out which capabilities impact your organization the most and start improving your Engineering health. Track and measure the DORA metrics, and prioritize your team metrics in one place.
Understand DORA To Improve Your Team
Software engineering teams are constantly looking for ways to improve their processes and delivery, and the chances are that your team is no exception.
With the DORA metrics, you can know how your team is performing, the overall health of your organization, and what you need to focus on to improve the efficiency of your engineering team.