Codacy Pulse now supports Bitbucket integration

We’re very excited to announce that Codacy Pulse now supports Bitbucket integration! You can collect changes and deployment data from Bitbucket repositories into Pulse’s Accelerate dashboard.
The Accelerate metrics, also known as DORA metrics, are a set of measurements that help organizations understand and improve the speed and efficiency of their software development processes. With these metrics, organizations can identify areas for improvement, optimize their development processes, and measure the impact of changes.
A product built on top of research excellence
We use three guiding principles when developing Pulse:
- Research-based: we’ll only add to the product metrics that are proven by research to have a positive impact on teams;
- The team over individuals: we won’t facilitate ways of controlling individuals but rather give tools for improving teams as a whole;
- Guidance: we’ll help interpret and derive actions from your metrics, even if you are unfamiliar with them.
Pulse provides end-to-end visibility over your Engineering health and practices. It gathers insights that empower your team on their continuous improvement journey.
We also use the annual Accelerate State of DevOps report (check out the 2022 edition) as a benchmark, allowing you to compare the performance of your teams to thousands of companies from all sizes and industries.
Start using Pulse
Get ready in under 2 minutes with our one-click integration
Setting up Pulse is very easy. You just need to:
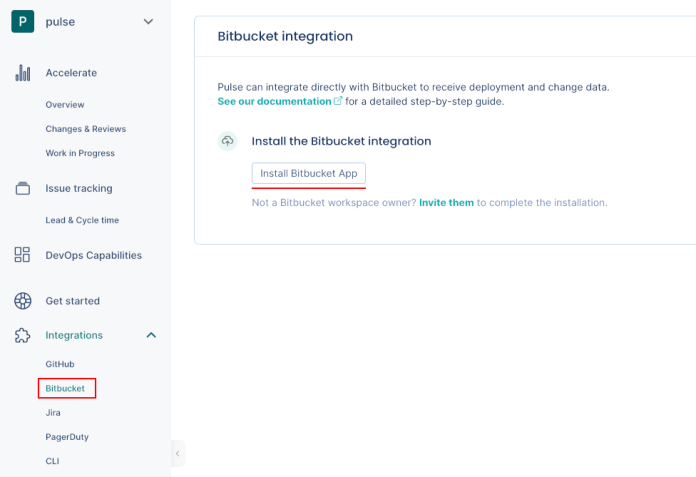
- On Pulse, expand Integrations and select Bitbucket
- Click Install Bitbucket App
- Choose the workspace that you want to connect the integration to and click Complete setup to confirm
- Wait until you get a confirmation that Pulse successfully connected the integration to Bitbucket.
And that’s it! You can also follow the step-by-step instructions on our documentation page.

Understand the Accelerate dashboard
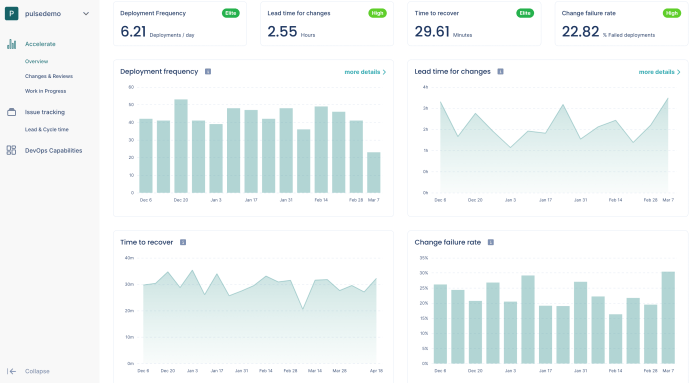
The Accelerate dashboard is where you’ll find information on the DORA metrics. You can use that information to:
- Understand the current health of the Engineering organization and individual teams;
- Set improvement goals and report Engineering OKRs with data;
- Justify investing in more DevOps tools or practices;
- Have informed conversations in 1:1s or retrospectives.
To do that, you can use the four key metrics presented in the dashboard:
- Deployment frequency: How often are we shipping value? It’s calculated as the number of Pull Requests merged to the default branch in a given week.
- Lead time for changes: How long does it take for us to ship value? It’s calculated as the median time between all commits and a Pull Request merge in a given week.
- Time to recover: For how long has our service been degraded? It’s calculated as the duration of production incidents.
- Change failure rate: How many deployments are faulty? It’s calculated as the percentage of deployments that caused an outage.
One remarkable aspect of these metrics is that they highlight the delicate balance between speed and quality. These first two metrics are focused on your organization’s speed, and the other two are focused on quality.

To calculate these and other metrics, Pulse relies on integrations with your source code management, incident manager, and issue tracker.
With our one-click integrations, you’ll be able to set up your dashboards and explore them in under 15 minutes. We currently support GitHub, Bitbucket, PagerDuty, and Jira natively, but an API is also available for collecting signals from other products or instrumenting more challenging workflows.
What you get with Pulse
- Peace of mind when collecting engineering metrics: we do the work for you, ensuring reliable metrics and continuous tracking.
- No need to choose what to measure: no need to get caught in output or vanity metrics that are hurtful for your team in the long run; we do the research for you.
- No committees to define how to measure: don’t get locked in discussions about the source of the data, where to instrument your workflow, or how to calculate each metric.
- Easily filter repositories, teams, and time periods, for a more focused data analysis.
- Our team and community are there for you: we help you on your journey of continuous improvement.
Empower your team with the DORA metrics. Connect now with Bitbucket (and GitHub) to find out which capabilities impact your organization the most and start improving your Engineering health. Track and measure the DORA metrics, and prioritize your team metrics all in one place.
Pulse features at a glance
To help you get started, we’re sharing a 5-min video tutorial showing how you can integrate your Bitbucket with Pulse. With our one-click integration, you be ready to go in no time. You can also follow the step-by-step guide on our docs page.
If you’ve any questions about this integration or want further guidance on setting it up, just let us know. We’d be more than happy to help you!
A glimpse into the future
Our team is working hard so that we develop new and exciting features for our Pulse product. For example, you’ll be able to use the changes and deployment data we collect with our one-click Bitbucket integration to unlock insights in the Changes & Reviews and Work in progress dashboard on Pulse. Over time, our work with Pulse will continue to evolve, so keep an eye on our roadmap here.
.svg)


